We no loner support V9. Try V11 instead it should still run on Win7. But of course Win7 is missing a few features compared to Win11 (e.g. PDF rendering and DirectX12 3D).
-
Hello , i ve tried the software yesterday, because it is among the Performance Test (9 , 10 , 11) the only that seems to give accurate results for Windows 7.
However, it seems no longer be possible to upload the results to the server. Getting error message upon completing the test after clicking "OK" to upload baseline.
ThanksLeave a comment:
-
I am a very long time use of the CPU and Video card performance pages from the Passmark web site. Today, I came across 'the new improved version', which in the past 3-4 years in the computer industry have almost NEVER been an improvement to the user. Here are the following complaints I have of this new user interface version:
1. It is MUCH harder to find the right place to click to get a useable list of CPUs, this being the list in order of the CPU model name. This really is the way this page (table) is used by most users because, unless you are building your own PC system, looking at the list of CPUs in order of their speed is only interesting, but not one that can be used. Normally, you find a PC system (laptop or desktop) and look up the CPU in that system to see if it meets your requirements, and if ordering from a site that allows you to 'build' your system, it gives you a method of determining the value (to you) for the extra cost for faster CPUs, and then you look up those CPUs and their speeds.
2. The list is now double spaced, and for no real reason at all. It looks somewhat strange, and it takes longer to get to the CPU you are interested in. There is no advantage to the use for this double spacing! This may also cause extra work when downloading the list into MS Excel or MS Word.
3. The headers of the CPU table are sporadically inter dispersed throughout the data, which is NOT helpful. I suggest that either they made to be static at the top of the page always, as you can do in MS Excel, or just remove them all other places other than the first one at the very top of the data. In addition, if I were to bring this data into Excel, I would have to manually go thru the entire data and remove all but the first ones. So many time web sites do not think about the user downloading the data into a tool that makes the list more usable, such as MS Excel, and having to remove all those worthless extra headers..
One more comment, which is not related to the poor 'new user interface' - there seems to be some confusion sometimes on how to order the data. I am speaking specifically of an Intel CPU listed in what I consider to be the 'wrong' place - not in the order of what I would considerate to be in. This CPU is model Intel Core i7-1065G7 @ 1.30GHz, and it is placed right after model Intel Core i7-995X @ 3.60GHz.. At first glance this would seem normal and correct. But, then the next Intel CPU i7-10xxx 10th Generation CPU model Intel Core i7-10510U @ 1.80GHz is listed much further down the list, after the model Intel Core i7-9850H @ 2.60GHz.. Right after the Intel CPU model Intel Core i7-1065G7 @ 1.30GHz, the CPU model number 'starts over' with the I7 list for CPU model Intel Core i7-2600 @ 3.40GHz, and continues to grow in model numbers again to the very end of the I7 list. I looked up the CPU in question, and it is a 10th Generation Intel CPU, and the naming of it is not all numeric as most other models are, and perhaps that is why I consider it to be 'out of place'. The Passmark list is just purely alphanumeric, and in this case, so in that sense, this model is in the 'correct' place, But, Intel has caused this to be a 'miss listed' CPU model as a result of their slightly different naming convention. But it may cause confusion with users when using the Passmark list, which is my real point here.
All my comments regarding the 'new improved user interface' may well also apply to the video card lists. On a different and very positive note, these lists provided by Passmark are OUTSTANDING, other than the new user format with my three major complaints. I give this the link to your site to any of my customers that are looking to buy a PC based computer, partially because they do not realize that the 'Ix' number does not tell the real speed story, and nor does the archaic 'GHz' value. This list gives the REAL story about CPU speed.
Vincent (10-15-2019)Leave a comment:
-
Does not seem any changes were made between 1018 to 1019 that would affect the physics tests. You can find the change log for PerformanceTest here.
Make sure all your drivers are up to date and then if you continue to have issues, can you run PerformanceTest in debug mode and send in the logs.Leave a comment:
-
Well Hello all with this new ver build 1019 now when I test CPU it crashes on the physics test did not do that in build 1018 so I thought it was my CPU so I went and uninstalled build 1019 and installed build 1018 and it works just thought I let you all know!
My System specs
Windows 10 build 1709
Processor: AMD Ryzen 1700 3.9 GHz
Asus Rog Crosshair VI hero
Memory: 16384MB RAM Gskill RGB Trident 16gb (16-16-18-18-52
Available OS Memory: 16384MB RAM
Page File: 2048MB
Card name: Asus dcII AMD Radeon R9 390 Series 8gb
Manufacturer: Advanced Micro Devices, Inc.
Chip type: AMD Radeon Graphics Processor
Display Memory: 16315 MB
Dedicated Memory: 8171 MB
Shared Memory: 8143 MB
Current Mode: 1920 x 1080 (32 bit) (144Hz)
Monitor Name: Nixus 24
Monitor Id:
Native Mode: 1920 x 1080(p
Device Name: G.SKILL RIPJAWS KM780 RGB Mechanical Gaming Keyboard - Cherry MX Red Switches
Device Name: Logitech G502s 12,000 dpi Laser Mouse
Power supply Corsair ax860i
Drive: C:
Total Space: 114.4 GB
File System: NTFS
Model: AMD R7 120gb SSD
Drive: D:
Total Space: 2000.00GB
File System: NTFS
Seagate SSHD 2TB drive
Leave a comment:
-
The graphs are all still there.
You need to click on the top Grey button. See the screen shot below.
Leave a comment:
-
The new UI doesn't seem to have the ability to show comparative graphs of all tests within a category. Have I missed something?
That was a great way to see, at a glance, whether successive runs have uncovered changes or problems in particular areas of operation. What I mean is something like this:
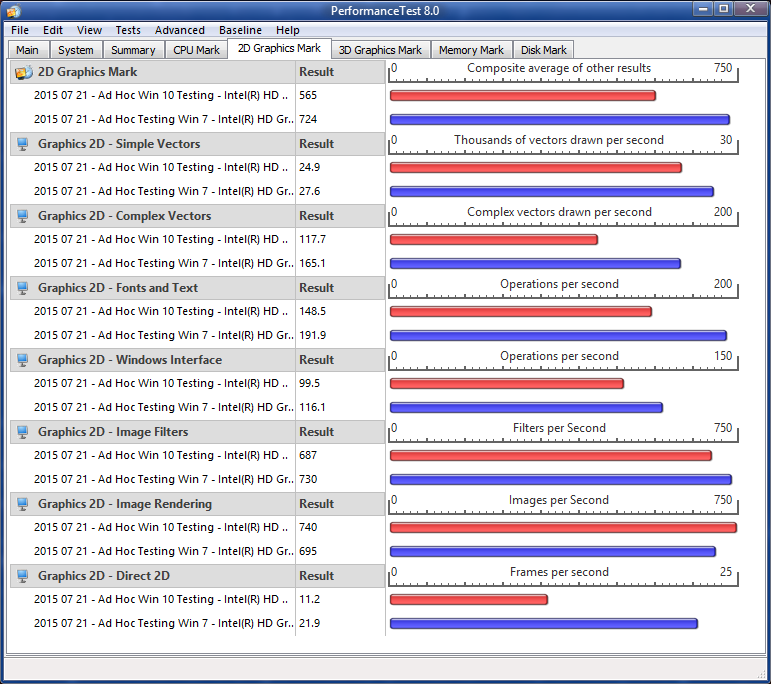
Is there a way to get this kind of category overview from version 9?
Thanks.
-Noel Carboni (licensed user of PerformanceTest versions 7 and 8 ).Last edited by NoelC; Mar-03-2017, 06:32 PM.Leave a comment:
-
I believe we were able to reproduce and fix this issue for the next release, if the PerformanceTest settings had the "User AppData" option selected and PerformanceTest was run off USB then although it would show the drive under test as the default (C: ) the test file could be created on the USB drive (as when running off USB it will override the locations of the AppData/UserData folders).Leave a comment:
-
On a different computer, HP Pavillion 23-G013W (or HP 23-G013W )I got the same type of results PT9 disk mark in the 140 range, PT8 disk mark in the 1350 range. Again, both run from USB Drive, Settings checked before running to insure C Drive was indicated as being tested. Benchmarks #473025 and 706976Leave a comment:
-
I did launch both from my USB Flash Drive, but checked the settings to insure it was (supposed to be) benchmarking the C Drive.Leave a comment:
-
Pagedude,
No, there should not be much difference in the results between V8 and V9.
I found your two baselines files. Numbers #706527 and #706522.
I think there must be some external factor effecting the disk scores. Scores in V9 were,
Read 21MB/sec
Write of 15MB/sec
Seek+RW: 1MB/sec
Which are super low scores. It is almost as if you benchmarked your USB flash drive and not the hard disk.
Leave a comment:
-
Just upgraded to Performance Test 9 and tested a laptop that scored 1440 in PT8, now only 750 in PT 9, The Hard Drive scores plummeted from PT 8 to PT9. Is this supposed to be that radical a difference, it's hard to benchmark comparison when the Disk Mark takes such a hit between versions. Seems I can't upload ptx file attachments here, but both results have been uploaded as an HP 250 G5 today 11-2-2016Leave a comment:
-
OK great news.
We might put a check into the software to prevent the DX12 test running on unpatched Win10 releases.Leave a comment:
-
Fair enuf I update my win and now dx12 test working just fine Ty guys!!!Leave a comment:
Leave a comment: